Have you ever felt overwhelmed by the sheer quantity of data your organization has at its disposal—particularly for online communications and engagement? Technology has made it easier than ever to connect with our supporters. But that doesn’t mean it’s easy to sift through the mountains of data that these digital platforms generate, and find the nuggets of insight that can drive improved performance.
In order to put data at the heart of decision-making, nonprofits need a clear process for finding and focusing on the handful of metrics that matter most. This means identifying metrics that directly connect to your strategy—and looking beyond the common “vanity metrics” (like page views or impressions) that executives and donors ask for, but that give little insight into audiences’ real engagement.
Data use cases are a shrewd way to get this clarity on your most meaningful data. In this blog post, we’ll briefly walk through how to create strong data use cases, as well as how to transform these use cases into effective data dashboards for your team.
Identify and prioritize your data by developing use cases
Data use cases are practical, powerful statements that emphasize two main things: (1) a specific insight you’re looking for (the “X”); and (2) a specific action that will be taken based on this information (the “Y”). By focusing attention on key actions and decision points, they point to how data helps inform and improve the quality of these decisions.
Here’s a typical data use case structure (in the style of Mad Libs):
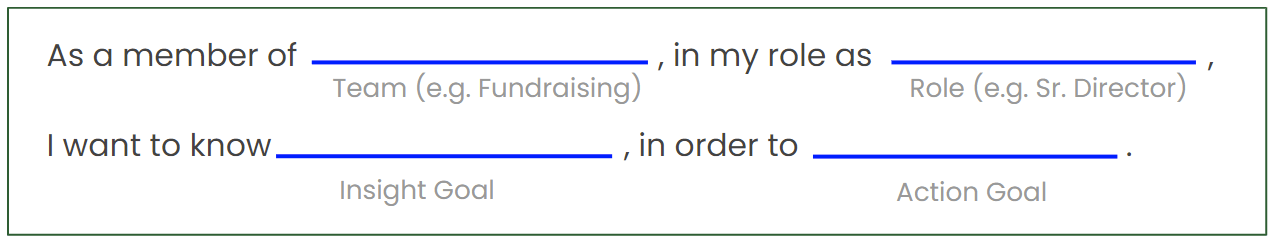
Each member of your team will have their own data use cases, depending on the day-to-day decisions they’re charged with making. As a data champion, your role is to collect these various use cases from stakeholders across your team or organization, prioritize the ones most critical to your collective success, and get to work finding relevant data in your systems.
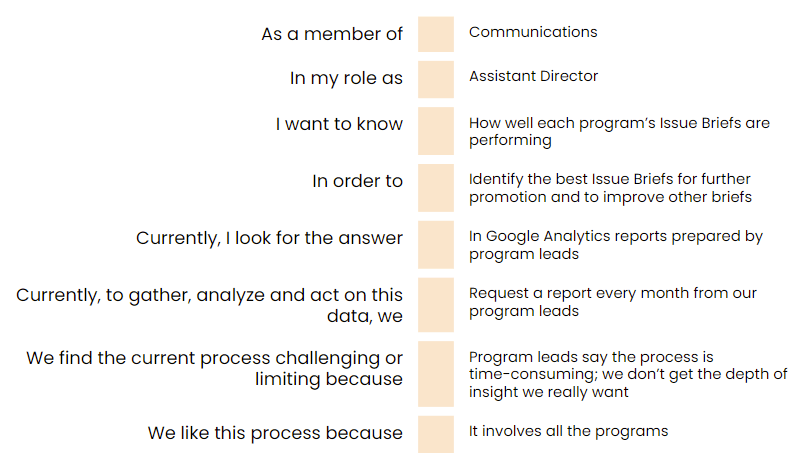
When formulating use cases, we also recommend gathering information on the process currently used to gather this key data. This helps you understand what is supporting – and perhaps hindering – your team’s ability to get, and act on, answers.
For example, below is a fictional data use case for a communications executive at a policy think tank. Note that, in this use case, we’re capturing information on both the goals of the executive (to identify her best-performing Issue Briefs), as well as the process of collecting and using this performance data (currently cumbersome, and yielding only superficial insight):

Transform data use cases into practical dashboards
Dashboards are powerful tools in analytics, putting useful and relevant data at your fingertips. With the right insights in the right hands at the right time, your team will delight in dealing with your data, making it a regular part of day-to-day decision-making.
Every effective dashboard starts with a purpose that serves as its organizing principle. If you’re putting a set of numbers together, why? What do these numbers have to do with one another? How is your team meant to respond upon seeing them? By developing data use cases, you grow well equipped to make subtle decisions about how to organize, style and annotate your dashboard so that it’s intuitive, and clear to the reader how they should take action based on the numbers.
If your organization’s data practice is nascent, you might start by manually gathering relevant metrics from Google Analytics and other platforms, and developing a basic Excel dashboard that tells a concise, cohesive story with your data. However, if you’re looking to integrate data into decision making on an ongoing basis, we strongly recommend a tool that will automatically feeds desired metrics into responsive digital dashboards with just a click of a button. Through tools like Google Data Studio, you can free up valuable time for your team, reduce errors that come from manual data entry, and enable your internal stakeholders to change reporting parameters on the fly based on their unique questions and business needs.
Need support in identifying and reporting on key data?
Many nonprofit communications professionals have seen the same old reports (with unique visits, page views, and impressions) over and over again—and rightfully begun to wonder if there’s more value they can be getting from their data. Rest assured, there is!
If you’re ready to take your team’s data and analytics to the next level, reach out to us and schedule a consultation. We have experts on our team who can transform your data strategy and build a process that will get more insights to your team and impact your audience in a more targeted way. We look forward to hearing from you!