What causes double counting, and what is its impact?
Have you ever noticed a major change in your Google Analytics stats? A sudden drop to a low bounce rate, or a big and enduring jump in pageviews? Sometimes this is a change in audience behavior because your publishing and outreach practices have made a difference, and other times you’ve just accidentally started double counting your data.
Your website analytics are captured by little bits of code that run in the browser anytime someone visits any one of your site’s pages. This little bit of code is simple, but there are many ways to set it up, and at most organizations there are many people who may take on the responsibility for managing it (web producer, social media manager, web developer, external web developer, etc…). What this means is that as a website grows, ages, and even gets replaced, it is not uncommon for this bit of code to end up on your website not once, but twice, on every page. Double the code, double the hits, and that is how you end up with double counting of pageviews.
It’s important to understand how this comes about, because I want to make sure everyone appreciates how easy it is for this to happen to your organization. In fact, we recently conducted a study and found that more than 1-in-15 of non-profit websites experience double counting in their Google Analytics from a list of 1,000 websites. Most often when it is discovered, double counting can be traced back to a new site launch or a new marketing vendor that adds code to the site, because the teams involved in these initiatives simply aren’t focused (and aren’t asked to focus) on analytics.
More than 1-in-15 non-profit websites tested experience double counting in their Google Analytics

Now some of the problems with double counting are obvious: you are recording twice as much activity as actually occurred, so you can end up overestimating the impact of your efforts, or undervaluing work you’ve done in the past. There are lots of ways this can skew your analysis of pageview data, but the impact goes even deeper and affects some of Google Analytics most central engagement metrics:
- Bounce rate
- Pages per visit
- Average time on page
 These metrics are industry standards for telling you how people are using your site, and in turn they suggest whether people are “happy” with your website. They all depend deeply on your pageview data, however, which means that double counting can throw them wildly off. Bounce rate, in particular, is defined by visits with a single pageview, so it will fall to the floor in the face of double counting, while pages per visit will naturally jump up (as much as double!) What might be less obvious is that your average time on page is also likely to drop considerably in the face of double counting—how much it drops will depend on your audience’s behavior, but we’ve seen it fall by as much as 70%.
If audience engagement with your website content is important to your organization, then losing reliability from these key engagement metrics is a great loss. Later on in this post we’ll talk about what to do about this, but first: how do you know if this is affecting you?
How to know if your website analytics are being double counted
 If you have access to your Google Analytics, use our companion dashboard to check your own data for warning signals of double counting. In this post, you’ll find 4 ways to check on your data to see if your pageviews are being double counted, and with the dashboard you can follow along live with the first two.
Bounce rate
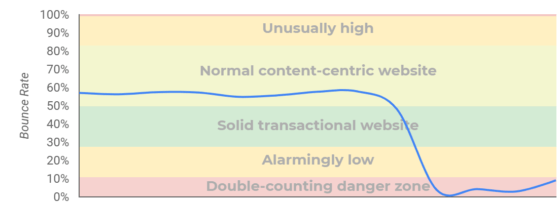
One of the first ways we usually notice double counting is through the bounce rate. As discussed, double counted pageviews can significantly affect core engagement metrics in Google Analytics, so look for a sudden drop and then consistently low bounce rate. How low is low? What a reasonable bounce rate looks like for your organization depends greatly on your site, your content, and your audience, however we usually start to worry if a bounce rate drops below 30%, and anything below 10% is often a sign that double counting, or something unusual is happening.
This test isn’t a slam-dunk, however. There are other possible explanations for a drop like this, but the biggest one is if you launch a new Google Analytics Event and have its “non-interaction” setting left to its default value of “False”. This is an easy situation to find yourself in, and while it can still make your life complicated, it isn’t quite as bad as double counting. If that doesn’t sound like your situation though, there are some more definitive tests.
we usually start to worry if a bounce rate drops below 30%, and anything below 10% is often a sign of double counting
Double-view vs. single-view pages
A more conclusive sign that you have been double-counting pageviews can be obtained by looking at your page view data. In an unusual test, you can count the number of pages that have had just a single pageview on a given day, and the number of pages with two pageviews. Every site ends up with some relatively low-traffic pages, resulting in a “long-tail” of pages that get only a single pageview. On a healthy site’s analytics, there should be more of these single-view pages than there are double-view pages. If there are more double-view pages, however, that is a strong signal that you have been double counting.
How well this test works may depend on how much content you have and how many distinct URLs you have, but the general idea is that if double counting is going on, then most content will have an even number of pageviews (2, 4, 6, 8…). You can pull your numbers offline and do this analysis, but it’ll be quicker to just take a quick peak in Google Analytics’ “All pages” report, go into the “advanced” search filter, and searching for results where “pageviews” equals “1”.
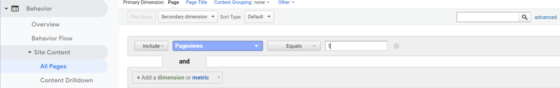
Do the same for “pageviews” equals “2”, and check the number of rows under the resulting report each time. The former should be higher than the latter, or you might have a problem! These results aren’t super intuitive, and as with the bounce rate tests, there may be other explanations (a big one is whether your data is being sampled!) However, this test is another good way to detect the impacts of double counting at a large scale across your data.
On the other end of the evidence spectrum, seeing specific and individual examples of double counting in action can help you confirm a diagnosis.
Look for examples in user reporting
One place where you can see easy-to-interpret examples of double counting in is in your user explorer data. The user explorer allows you to inspect the activity of an individual user or “client id” as they make your way through your site. This includes step-by-step views of each page.
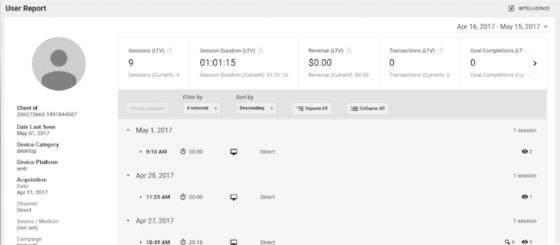
This report makes it clear when a site is experiencing double counting as it lists the page titles an individual looked at, and it shows how many times the person viewed that page on the right. Here again, you’ll see every page listed with 2 views as two pieces of code on your site send the same hit to your Google Analytics.
Directly observe in Google Analytics Debugger
When in doubt, it helps to experience a technical problem live and for yourself, and to that end I recommend installing the Google Analytics Debugger plugin for Google Chrome. Once set up, it will open the Console view of your browser and it prints a log of every hit to a Google Analytics account as it occurs in your browser. The report contains a ton of information, including details about which versions of Google Analytics are sending the data.
Once again, the trick here is to look for two pageviews side by side. Bear in mind that it is okay to have a pageview and one or more GA Events fire on a given page, and you might even have to legitimate pageviews sending to separate accounts (or other more complex setups), so to catch double counting you’ll need to look a little closer at the details to find two pageviews that both share the same “trackingId” (with values of the form UA-########-#).
What to do now that you know you have double counting in your data
Once you’ve identified a big problem like this in your data, the ultimate goal should be to fix it, but you might want to bear a few things in mind along the way. You are going to remove one of the two snippets, but it might not be obvious which one to take away. Depending on the history of the code on your site, you may not only have two pageview snippets, but two parallel ecosystems of Google Analytics code, each of which is responsible for customization and useful features like engagement tracking with events. It is important to understand why you have two code snippets when you decide which one to retire.
And keep in mind that when you make this change, it is going to have ripple effects throughout your data as metrics like bounce rate, time on site, and pages per visit change significantly. This can greatly complicate the life of any analyst who tries to make sense of this data and explain to your team what it means for content performance and audience engagement. There is a lot to say about how to recover insights from double counted data (not all is lost!) and the solutions vary on a case-by-case basis, but at a minimum, be sure to annotate your Google Analytics with the change and otherwise document internally when the issue and its resolution occurred so the data is treated appropriately.
And last but certainly not least, recognize that discovering an issue like this can have ripple effects throughout your organization as your colleagues and leadership hear about it. Reliability issues in data are common, but double counting is a severe one and it can undermine trust in your data, which in turn can keep your organization from using data to its full potential far into the future (long after the issue is resolved). For this reason, think carefully about what you do when you resolve this and how you communicate about it to your peers.
So, in short, here is your checklist:
- Plan before you act, so you don’t create new problems by acting hastily
- Determine which Google Analytics snippet you can afford to lose, likely the one that is older or is less integrated with other analytics tracking
- Delete it, merging any important functionality into your other GA setup
- Document the impact for yourself and anyone else who might use Google Analytics data so they can change how they interpret the data
- Take the opportunity to grow your data practices so this disruption in your data isn’t a recovery, but a rebirth of your analytics
- Proactively talk to colleagues about fixing double counting as a triumph (rather than a lapse) of data stewardship
As unfortunate as it is with double-counting in the first place, it is a triumph to have discovered and resolved it. Celebrate the improved accuracy of your data, especially for GA’s foundational engagement metrics, and help the organization realign expectations around a new baseline. Given the upheaval this can cause in your data, you might also take this opportunity to make even bigger changes to your analytics, such as adding new audience engagement metrics, combining analytics between other separate organizational sites, or even timing the analytics code correction with the launch of an entirely new website that can boast more accurate tracking.
As with anything in data strategy, simply resolving double counting in your analytics is less important than what you do with the data after you’ve fixed it. In our work we often encounter double counting “along the way” while addressing an organization’s strategic needs, and we’ll just as often resolve the issue as a part of a broader data strategy project that addresses the change as a part of a new forward-looking analytics reality.